About Me
I am Su Htar,
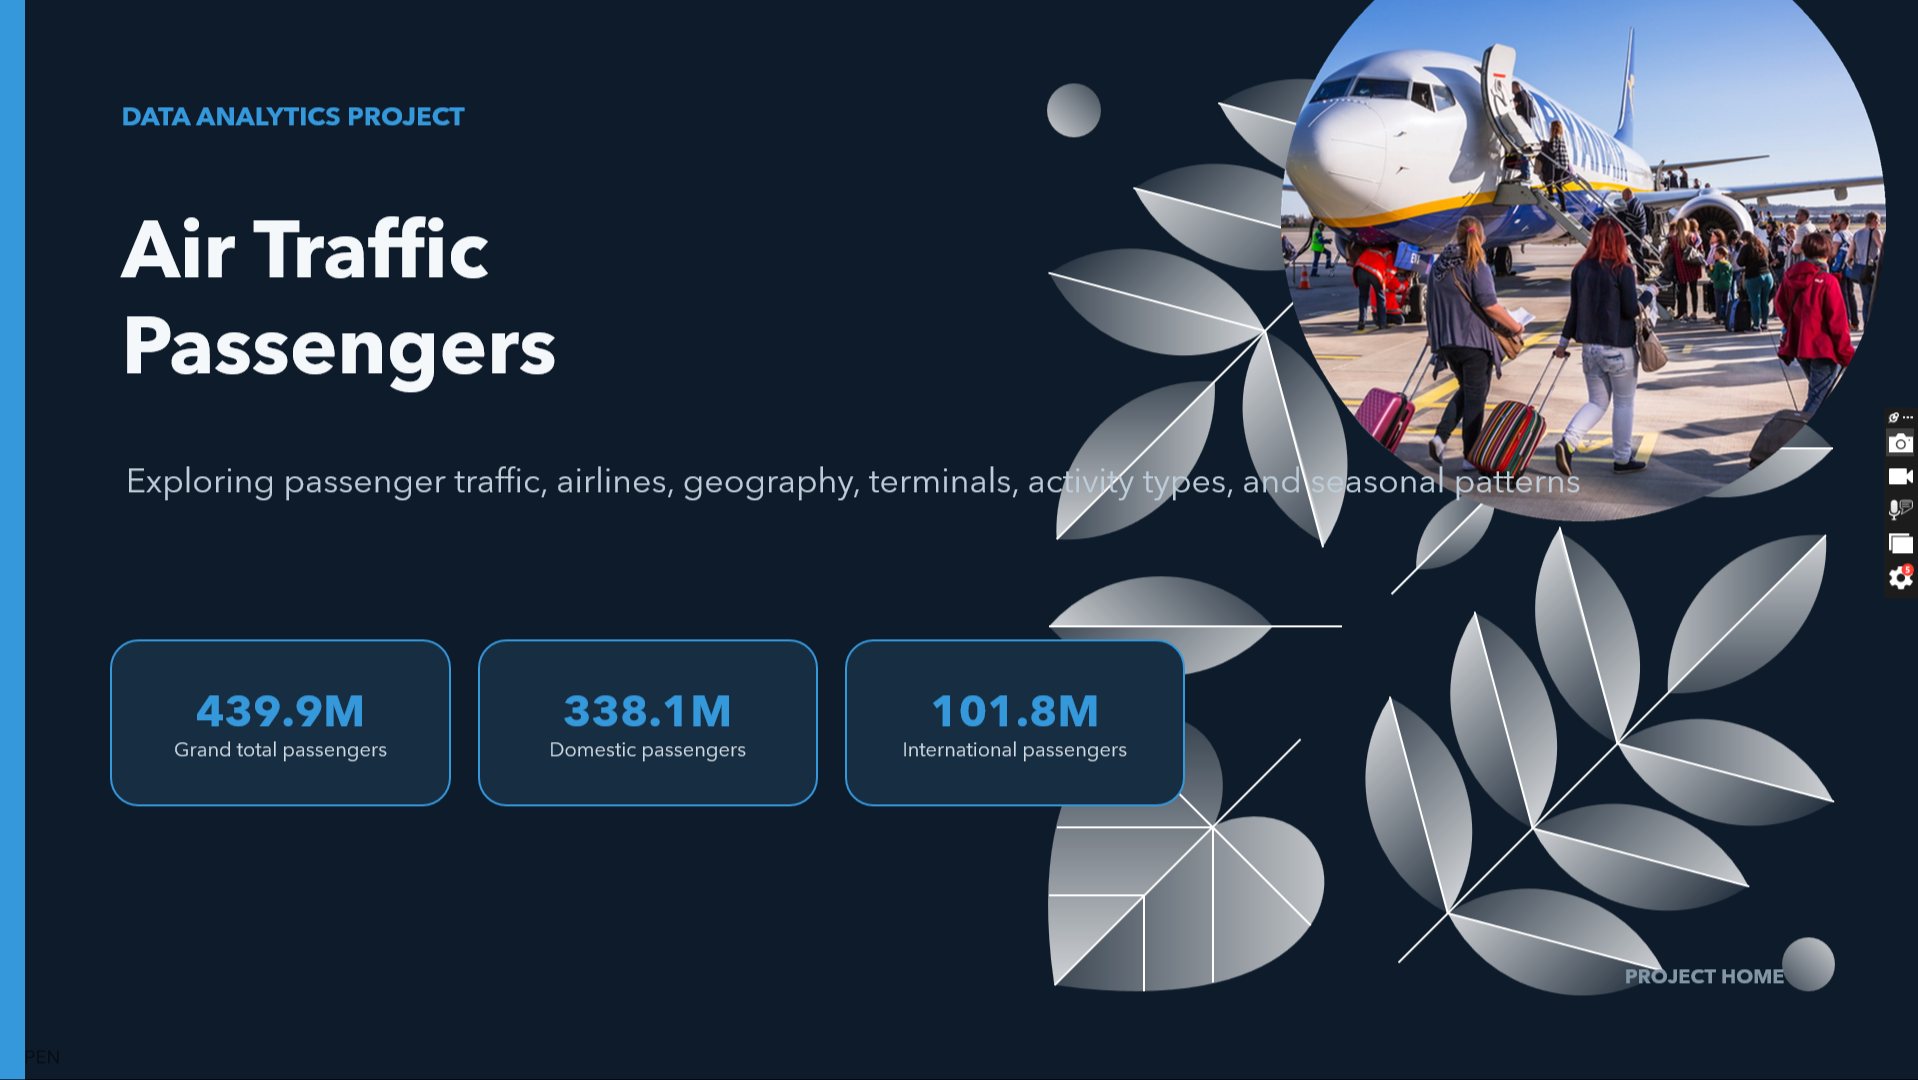
Business Intelligence Analyst with 6+ years of technology experience, including 4+ years in BI, data analytics, data modeling, and reporting. I transform complex data into actionable insights through SQL, Python, Power BI, AWS Redshift, and Microsoft Fabric, helping teams understand performance and make data-driven decisions. With a software engineering background and Microsoft certifications in Power BI and Fabric Analytics, I bring both analytical and technical expertise to building practical data solutions.
Highlights
- 6+ years of total technology experience, including 4+ years specializing in Business Intelligence, data analytics, data modeling, and reporting.
- Experienced in transforming complex, multi-source datasets into actionable business insights, performance reports, and data-driven recommendations.
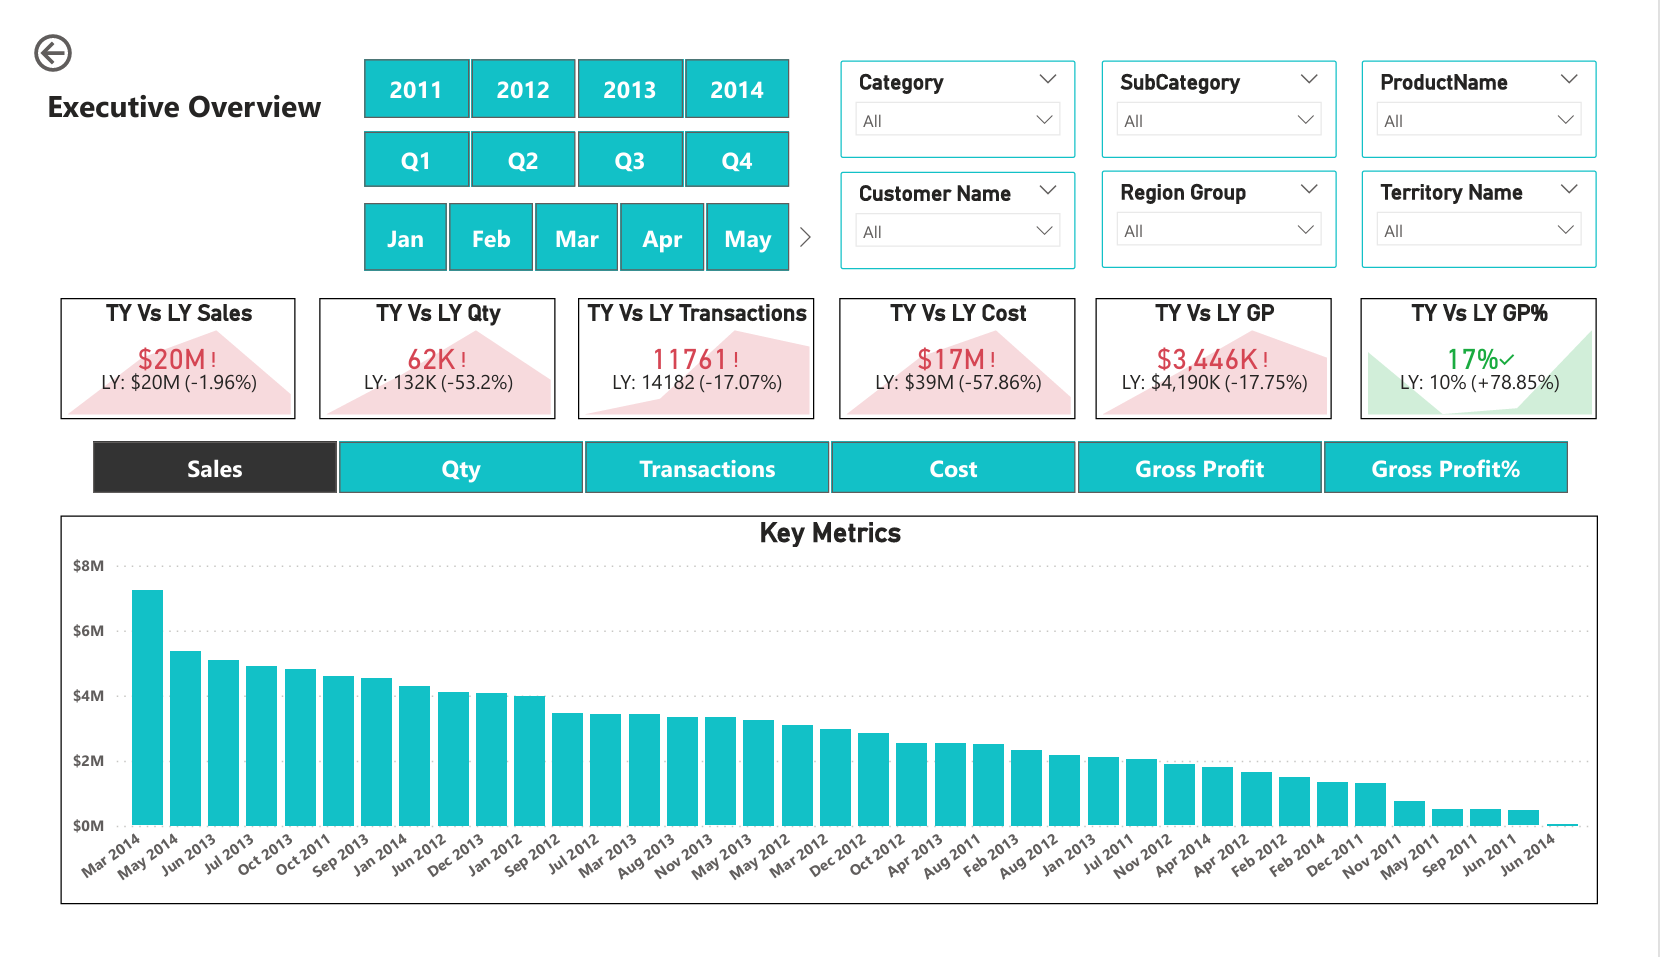
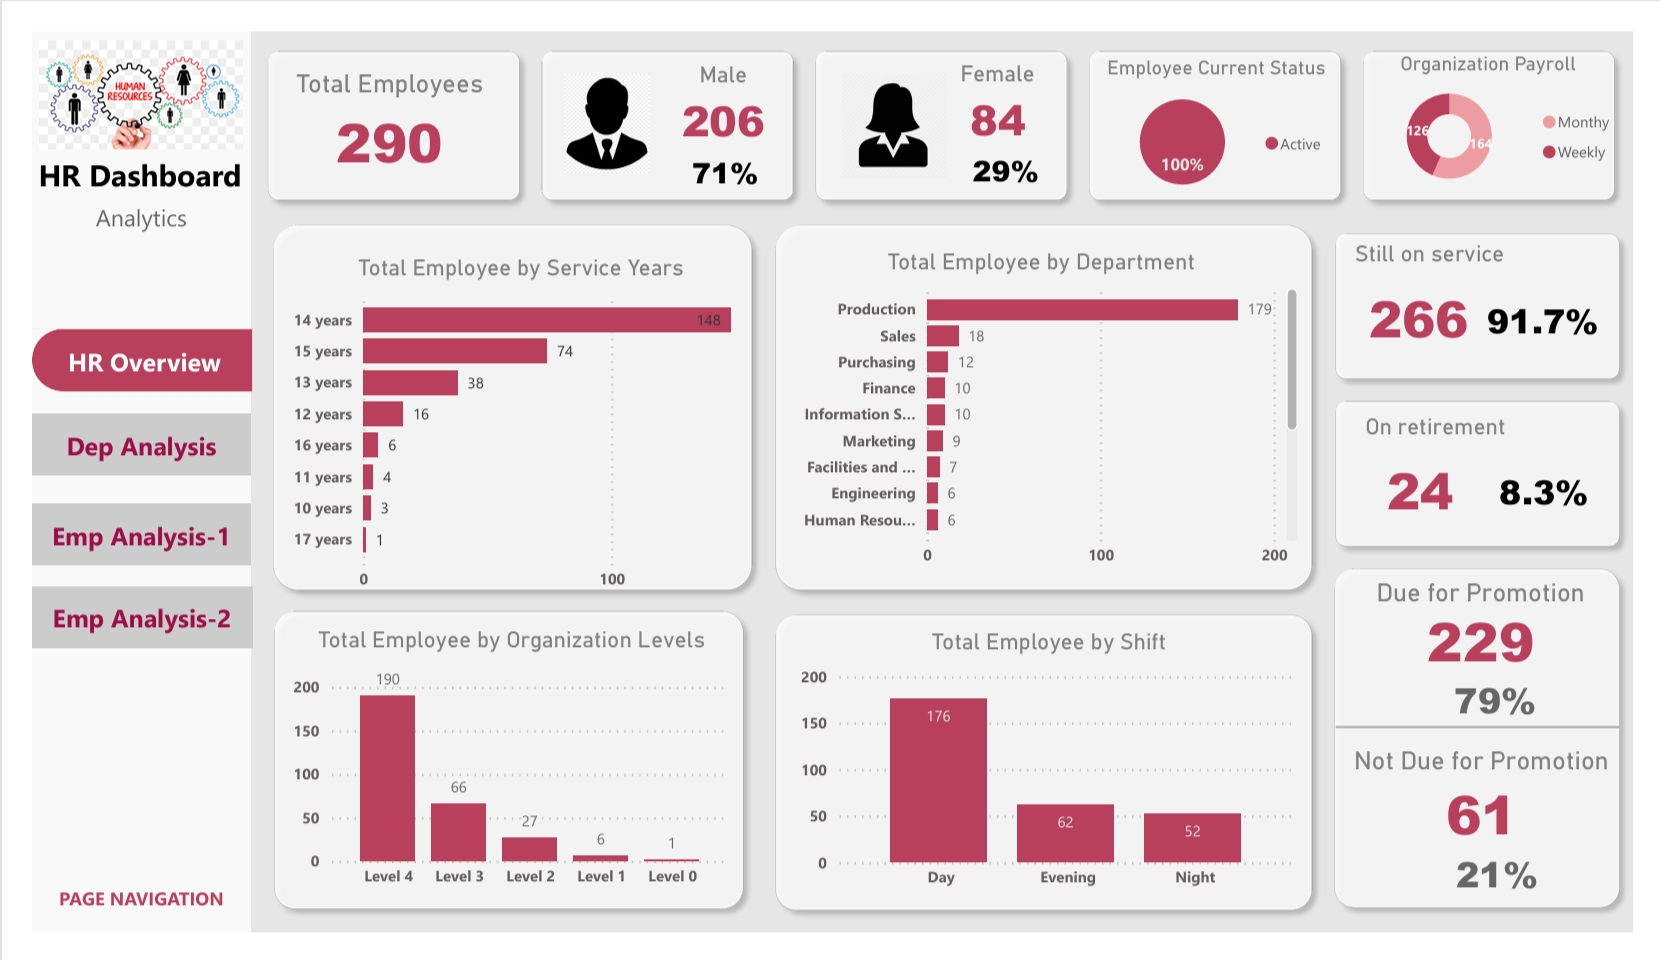
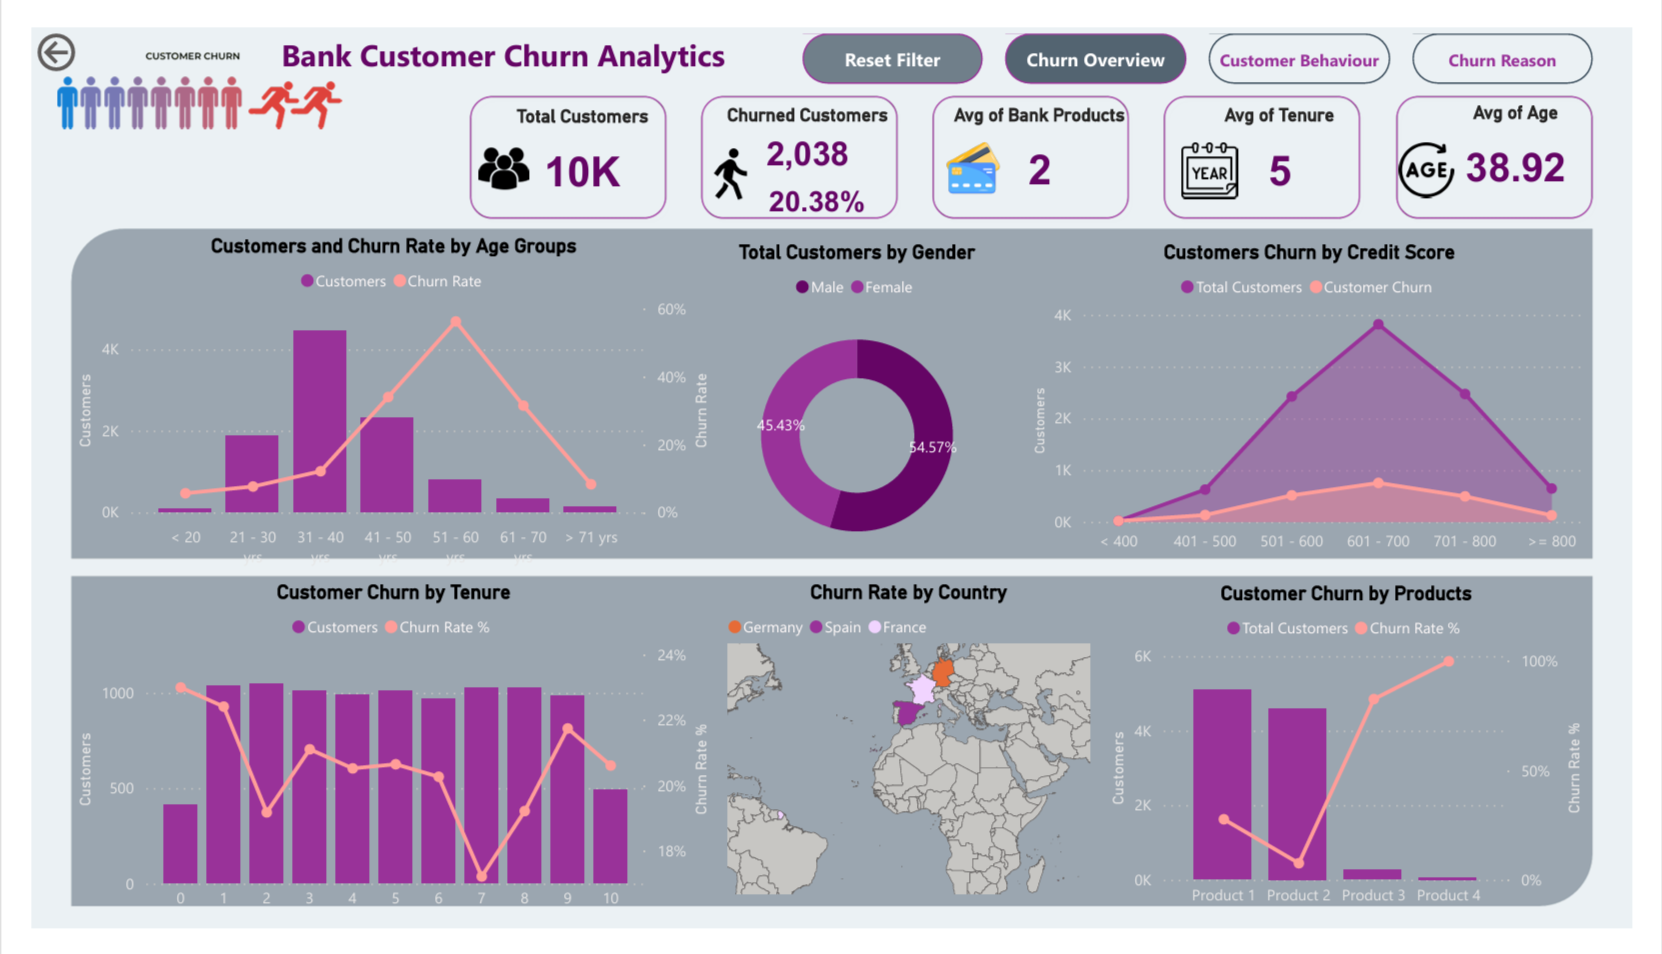
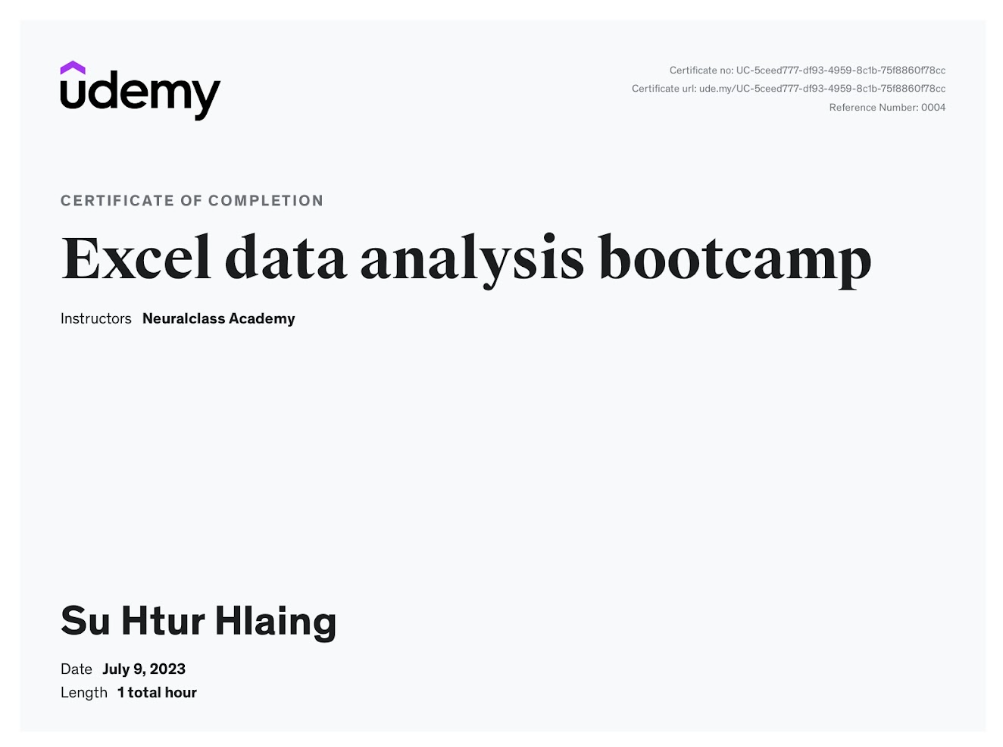
- Hands-on experience developing Power BI dashboards, analytical reports, data models, and automated reporting solutions.
- Strong technical expertise in SQL, Python, Power BI, AWS Redshift, and Microsoft Fabric.
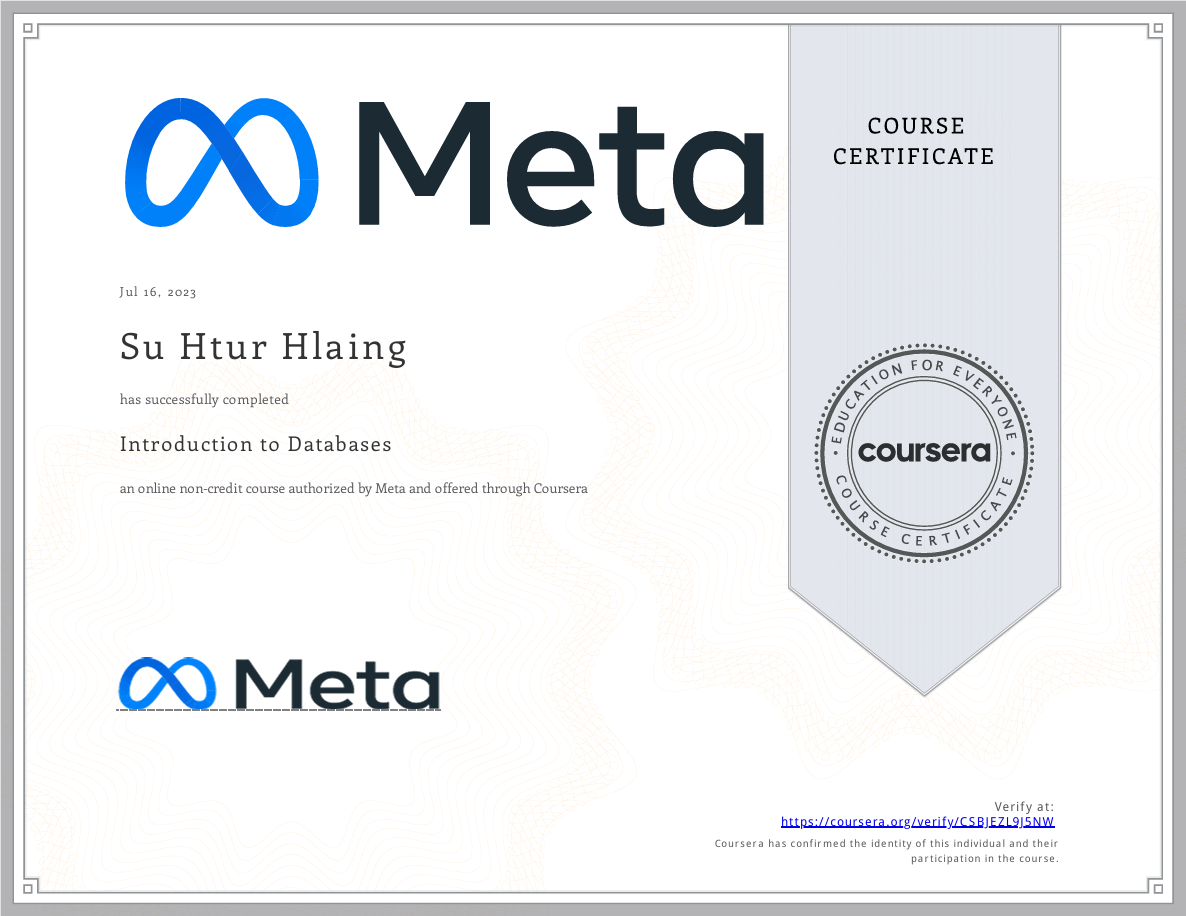
- Experienced in data migration and modernization, including migrating data from on-premises environments to AWS Redshift and Microsoft Fabric.
- Experience supporting new core banking data migration, including data preparation, transformation, validation, and reconciliation.
- Strong background in data analysis, BI reporting, reporting automation, data quality, and technical problem-solving.
- Previous software engineering experience, providing a strong foundation in application development, databases, and technical solution development.
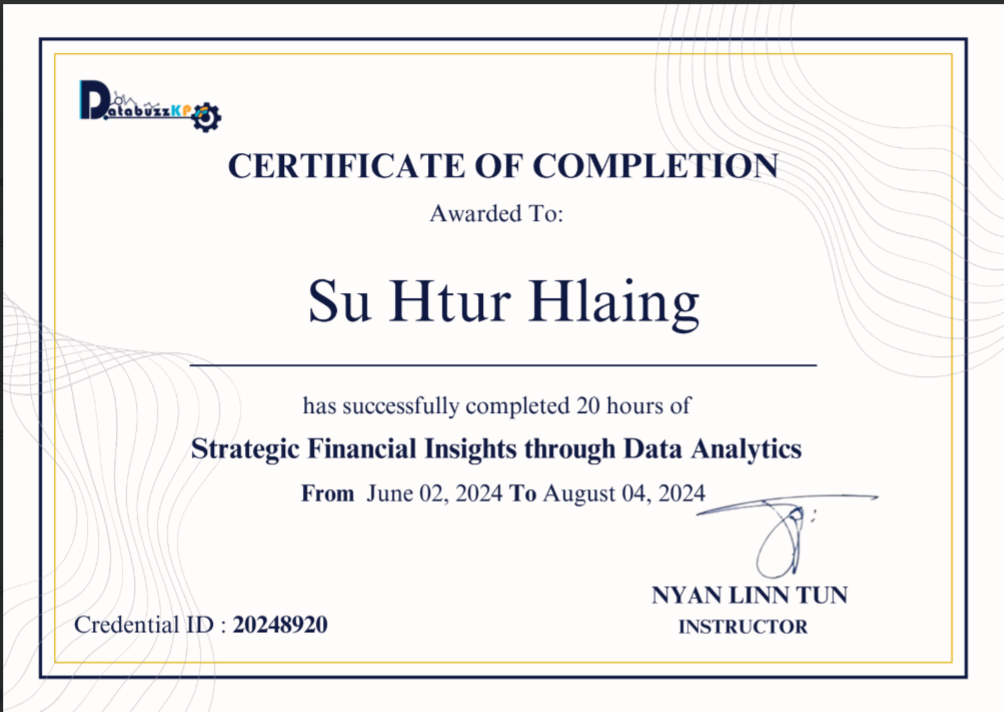
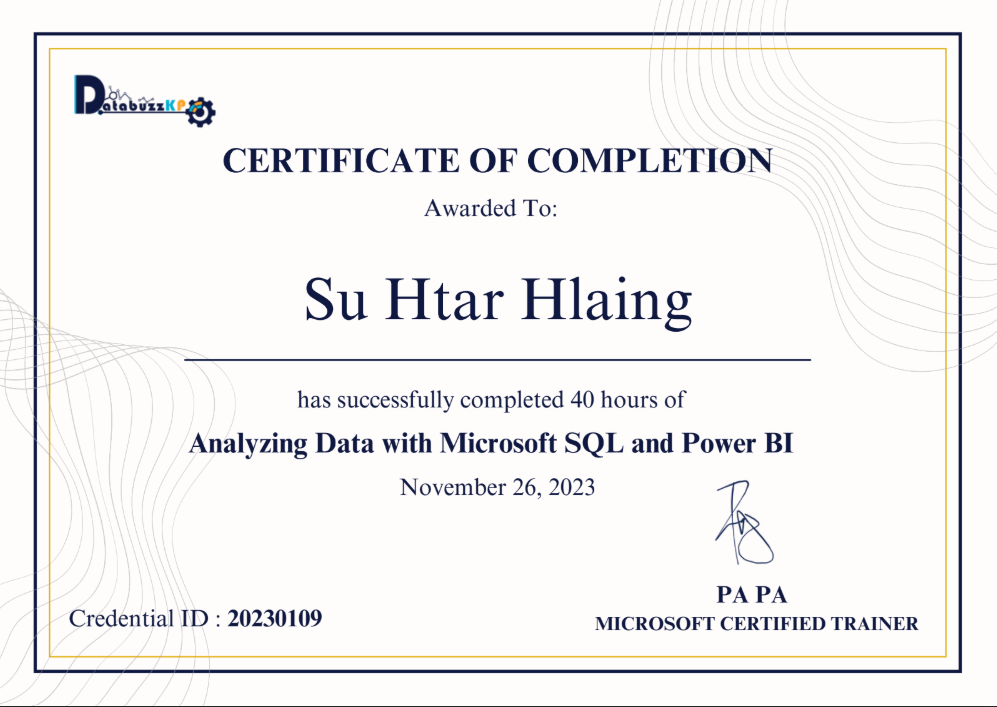
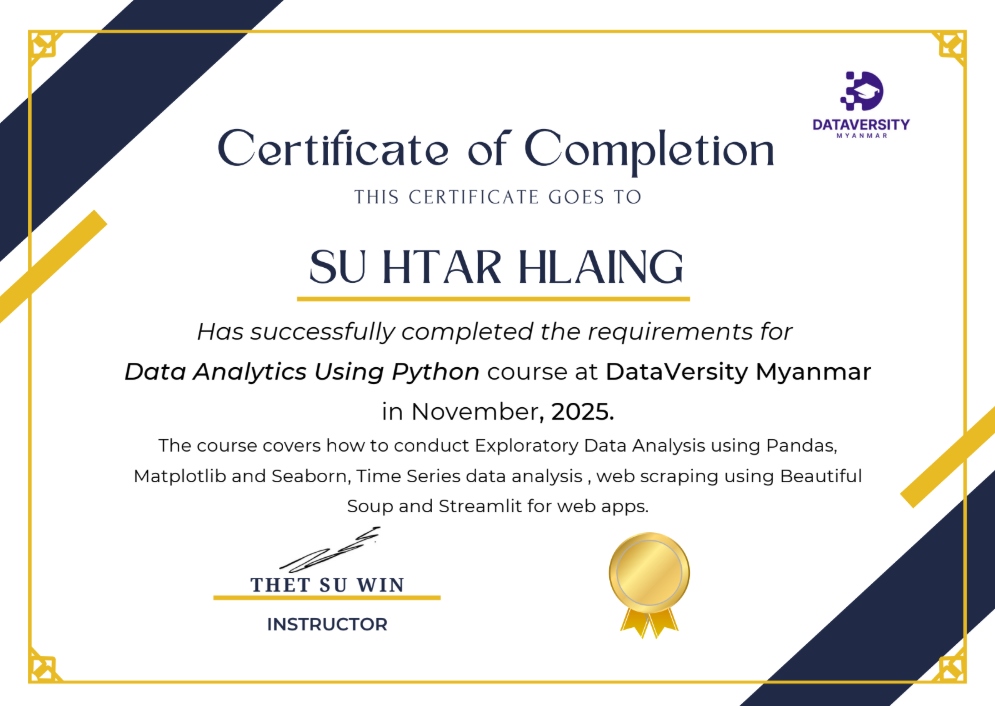
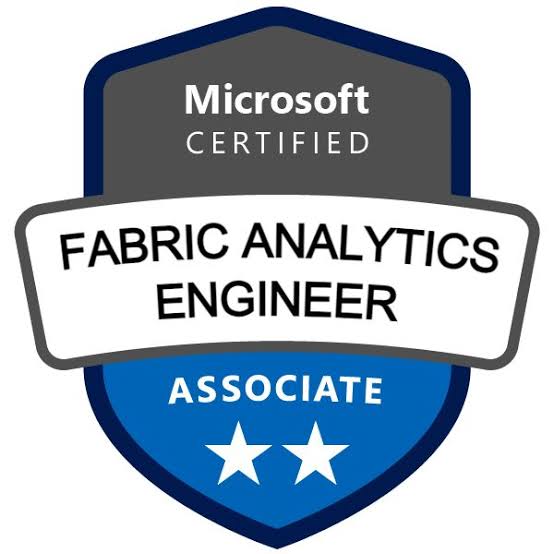
- Microsoft-certified in Power BI and Fabric Analytics, with a B.C.Sc. in Computer Science.
Skills
- BI & Analytics Business Intelligence, Data Analytics, Business Insights, KPI Analysis, Trend Analysis, Campaign Analysis, Data Visualization, Reporting Automation
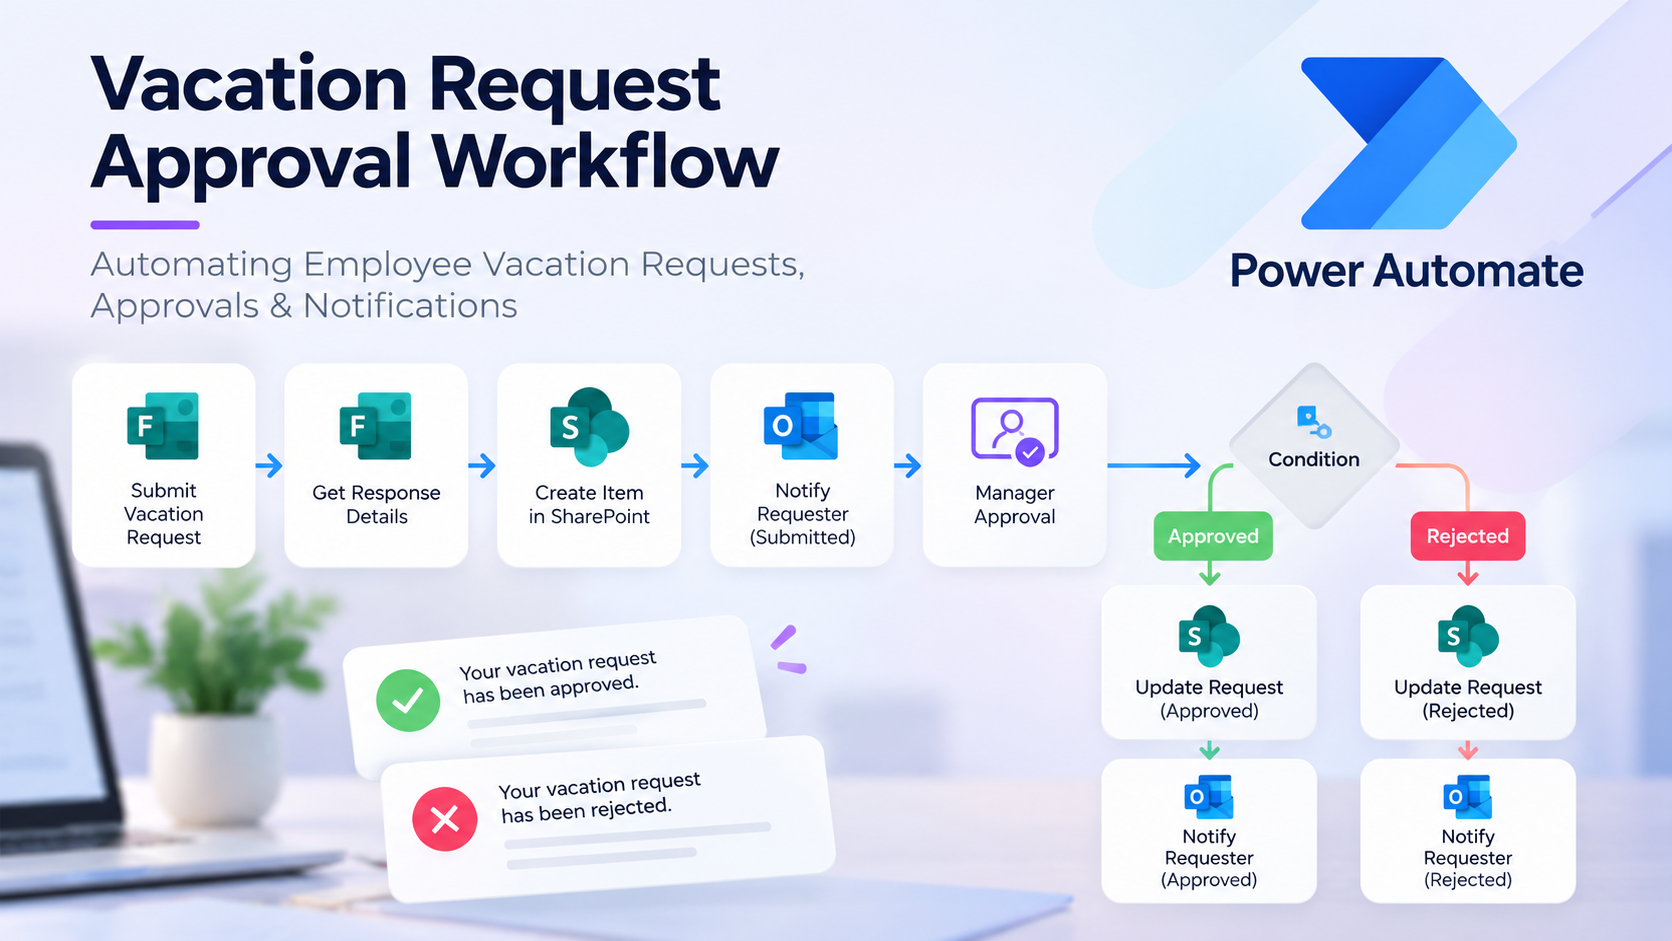
- BI Tools Power BI, Looker Studio, Power BI Paginated Report, SSRS, Power Automate, Dashboards
- Data & Databases SQL, SQL Server, MySQL, Oracle, AWS Redshift, Microsoft Fabric
- Data Engineering & Quality Data Modeling, Data Architecture, Data Migration, Data Transformation, Data Validation, Data Cleansing, Data Quality, Data Governance, Performance Tuning
- Programming Python, JavaScript, PHP, React.js, HTML, CSS
- Cloud & Platforms AWS, Microsoft Fabric, Databricks
- Tools Excel, SharePoint, Google Sheets, Google Analytics, Jira, Confluence, GitHub, Flow.io
- Languages English : Intermediate, Burmese(Myanmar) :Native